

Hosting consolidation is usually discussed as one story with one direction: the big get bigger, the independents sell, the logos disappear. Our own market data says something more useful. There are two consolidation strategies running at once, they produce opposite-looking companies, and the number that separates them is how many domains sit behind each brand a group owns.
At one end, GoDaddy carries 72.9 million domains under three brands visible in the DNS, an average of about 24 million each. At the other, team.blue carries 6.7 million under 41 brands, an average of roughly 163,000. Both are buyers. Both show up in every conversation about consolidation. They are doing close to opposite things with what they buy, and the gap between those averages is about a hundred and fifty to one. For anyone weighing a sale or an acquisition, that difference shapes who is likely to bid and what happens to the name afterward.
Key facts (our Market Insights data, read August 11, 2026)
- What we track. 34 hosting groups across more than 224 brands, with domains attributed to whoever operates the DNS answering for them.
- Two models, one measurement. Scale buyers keep few brands and load each heavily: GoDaddy averages 24.3 million domains per brand. Federated buyers keep many and load each lightly: team.blue averages 163,000. The table below has the full spread, including the hybrids in between.
- Brand count does not buy growth. In the latest 30-day window, team.blue’s 41 brands grew 1.3%, while Tucows grew 9.2% on five and GMO Internet 7.7% on six.
- More mid-table movers. Identity Digital +5.6% and Runiti +5.1% also outpaced every group in the top five, where GoDaddy managed +2.5% and the rest between +0.7% and +1.5%.
- Almost nobody is shrinking. Of the 34 groups, only three lost ground in the latest 30-day window, and none of them by more than half a percent.
- Most of the market sits outside the groups. The top five groups hold 31.4%. Adding up all 34 gets to roughly 39%, which leaves about six in ten tracked domains outside every group we follow.
- What that leaves for buyers. Not a handful of large targets but a long tail of national leaders. In our 117-country data, providers such as Hoster.by and superhosting.bg hold close to half their home markets.
Three Brands, or Forty-One
The clearest way to see the split is to divide each group’s domains by the number of brands it operates. The result separates companies that buy scale from companies that buy presence.
| Group | Domains | Brands | Domains per brand | 30d |
|---|---|---|---|---|
| GoDaddy | 72.9M | 3 | 24.3M | +2.5% |
| Namecheap | 15.9M | 2 | 7.95M | +0.7% |
| United Internet / IONOS | 20.8M | 12 | 1.73M | +1.3% |
| Newfold Digital | 11.8M | 12 | 983K | +1.5% |
| group.ONE | 3.5M | 12 | 292K | +0.6% |
| team.blue | 6.7M | 41 | 163K | +1.3% |
| your.online | 3.0M | 29 | 103K | +1.1% |
| World Host Group | 1.0M | 11 | 91K | +0.6% |
| Miss Group | 829K | 15 | 55K | +1% |
Brand count alone does not place a group. United Internet, Newfold Digital and group.ONE all run 12 brands, yet they average 1.73 million, 983,000 and 292,000 domains each. What separates them is the size of what they bought, which is exactly why the per-brand figure is the more telling number.
The federated buyers are explicit about the logic. your.online describes its approach as a decentralized model that supplies capital and expertise while preserving local identity. team.blue markets an ecosystem of brands that are locally rooted, claiming presence in 23 European Union countries and top-ten positions in ten of them. Miss Group, founded in 2014, has assembled 15 brands we can see in the DNS in a dozen years.
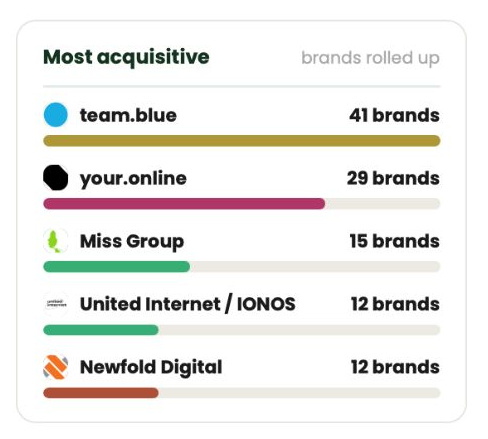
Brands rolled up per group, from the same snapshot. The two most acquisitive buyers by brand count run the two smallest portfolios per brand.
Neither approach is obviously right. The scale model concentrates support, billing and infrastructure behind one name and spends nothing maintaining forty brand identities. The federated model keeps the local name customers already trust, which matters in markets where a national brand outsells a global one, and it lets a buyer enter a country without competing there from scratch. What the data adds is that the choice is visible from outside, years after the deals close, in the shape of the portfolio.
In the Latest Window, the Middle of the Table Outran the Top
Over the dataset’s most recent 30-day window, the largest groups moved slowly. GoDaddy added 2.5%, Newfold 1.5%, United Internet and team.blue 1.3% each, Namecheap 0.7%. The faster movement sat one tier down: Tucows +9.2%, GMO Internet +7.7%, Identity Digital +5.6%, Runiti +5.1%. XBT Holding posted the largest percentage of all at +21.1%, though on a base of only 39,000 domains, where a single migration moves the number.
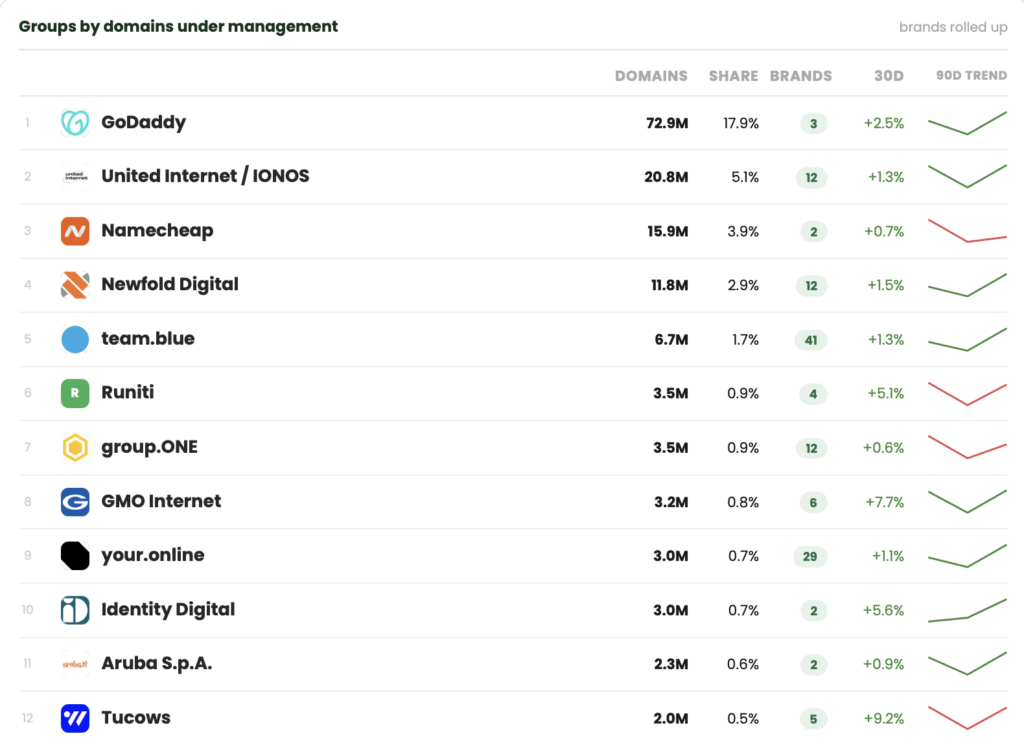
The group table in our Market Insights dataset, snapshot July 24, 2026. The 30d column and the 90-day trend lines cover the window discussed here.
Two things follow. First, growth at this level is not the same as growth in revenue, because a domain under management is not a paying hosting customer, and a month is a short window on a dataset built from DNS observation. Second, and more to the point, owning more brands did not correlate with growing faster. The two most acquisitive groups by brand count, team.blue with 41 and your.online with 29, grew 1.3% and 1.1%. Tucows moved about seven times faster on five brands. Whatever a large brand portfolio buys, in this window it did not buy momentum.
Six in Ten Domains Belong to No Group We Track
The headline concentration figures make the industry sound further along than it is. Our concentration index reads 511 and points toward consolidation, and the five largest groups do hold 31.4% of tracked domains. But adding up the published share of every one of the 34 groups gets to only about 39%. The remaining six in ten domains sit with operators that belong to no group we track.
The bottom of the table points the same way. Shrinkage is rarer than the consolidation narrative implies: only three groups lost ground, InMotion Hosting and CloudOne Digital at 0.5% each and HostPapa at 0.1%. Everything else grew, most of it slowly.
Our country-level data, covering 117 markets, shows where much of that outside share sits. In dozens of them, the market leader is a national provider rather than a global platform, often by a wide margin. Hoster.by holds 49.6% in Belarus and superhosting.bg 47.5% in Bulgaria. Norway, Estonia, Lithuania and Kazakhstan are led by domeneshop.no, Zone.eu, serveriai.lt and ps.kz, on shares between 36.3% and 42.9%. Whether any of these is independent or already inside a portfolio is a question for the cap tables rather than for DNS records. What the numbers describe is the shape of what remains: not a handful of large targets, but a long tail of national leaders, many commanding a third to half of their home markets.
That shape appears particularly compatible with the federated model, which is presumably why it exists. A group already running 41 brands has a repeatable process for absorbing such a company without dismantling it, and each addition moves its total by a fraction of a percent. It also explains why consolidation feels relentless while the concentration numbers barely move. Dozens of small acquisitions per year can leave the top of the table looking almost unchanged, and in the latest window, that is exactly what they did.
Hosting M&A Consultation
Get one-on-one advice on maximizing your hosting company’s valuation and navigating the sale process.
About the Data
Figures come from our own Market Insights dataset (snapshot July 24, 2026; 30-day changes end then), which attributes each domain to whoever operates its DNS. A brand here means a distinct DNS footprint: brands running on a parent’s DNS, or folded into it after an acquisition, disappear into the parent. That is why we count 41 brands for team.blue against the more than 60 it advertises. The bias understates our thesis: at 60-plus brands, team.blue’s average falls below 120,000 and the headline gap widens past 200 to one. Domains-per-brand and the 39% group total are our own arithmetic on published per-group figures.
