

We selected five publicly traded companies that span the hosting, cloud and domain economy, and right now the market prices a dollar of their EBITDA, the operating-earnings measure most larger deals are priced on, at anything from under 8 times to almost 40. The spread is the story. GoDaddy, with $5.1 billion in trailing revenue, is worth less today, by market value, than DigitalOcean, whose revenue is five times smaller. OVHcloud has the highest EBITDA margin of the four hosting and cloud names on the uniform measure and carries the lowest multiple of all five. Every one of those apparent contradictions has a reason, and the reasons reflect many of the same questions a buyer will bring to a private hosting business, even at a much smaller scale.
Key facts
- The ladder: enterprise value to trailing EBITDA, measured identically for all five, runs 7.8x (OVHcloud), 11.0x (GoDaddy), 11.7x (IONOS), 23.3x (Verisign), 39.6x (DigitalOcean), by our arithmetic on filings and August 31 closing prices.
- Growth outweighs size here: DigitalOcean grows revenue at 28.6 percent year over year; the other four grow at 6 to 7 percent.
- Definitions move multiples: on its own adjusted measure GoDaddy is 8.9x, not 11.0x; the table shows both sets, ours and the companies’ own.
- All figures are our calculations from company filings and August 31 closing prices; the two European companies report adjusted EBITDA under their own definitions.
Five Price Tags, Side by Side
| Company | Trailing revenue | Growth | EBITDA margin | EV/EBITDA |
|---|---|---|---|---|
| GoDaddy | $5,104M | +6.6% | 26.6% | 11.0x |
| DigitalOcean | $1,011M | +28.6% | 31.8% | 39.6x |
| IONOS | EUR 1,362M | +6.9% | 34.5% | 11.7x |
| OVHcloud | EUR 1,104M | +6.9% LFL | 39.1% | 7.8x |
| Verisign | $1,708M | +6.0% | 69.4% | 23.3x |
Trailing twelve months to June 30, 2026 for all but OVHcloud, whose fiscal half-years run to February 28; growth is the latest reported year-over-year rate, and OVHcloud’s is organic, like-for-like, against a reported 6.5 percent. Enterprise value is market capitalization at August 31, 2026 closing prices plus net debt per the latest report; DigitalOcean’s is pro forma for July 23, when a 12.5-million-share offering funded the retirement of $471.8 million of its convertible notes. The uniform column measures every company the same way, operating income plus depreciation and amortization; the adjusted column shows what each company’s own preferred measure yields, GoDaddy’s NEBITDA and the adjusted EBITDA of DigitalOcean, IONOS and OVHcloud. Verisign does not report one, and the margin column follows the uniform measure. Verisign, the .com registry, is not a hosting company and sits in the table as a contrast. The choice of definition alone moves GoDaddy from 11.0x to 8.9x, which is a lesson of its own: a multiple means nothing until the earnings measure under it is pinned down.
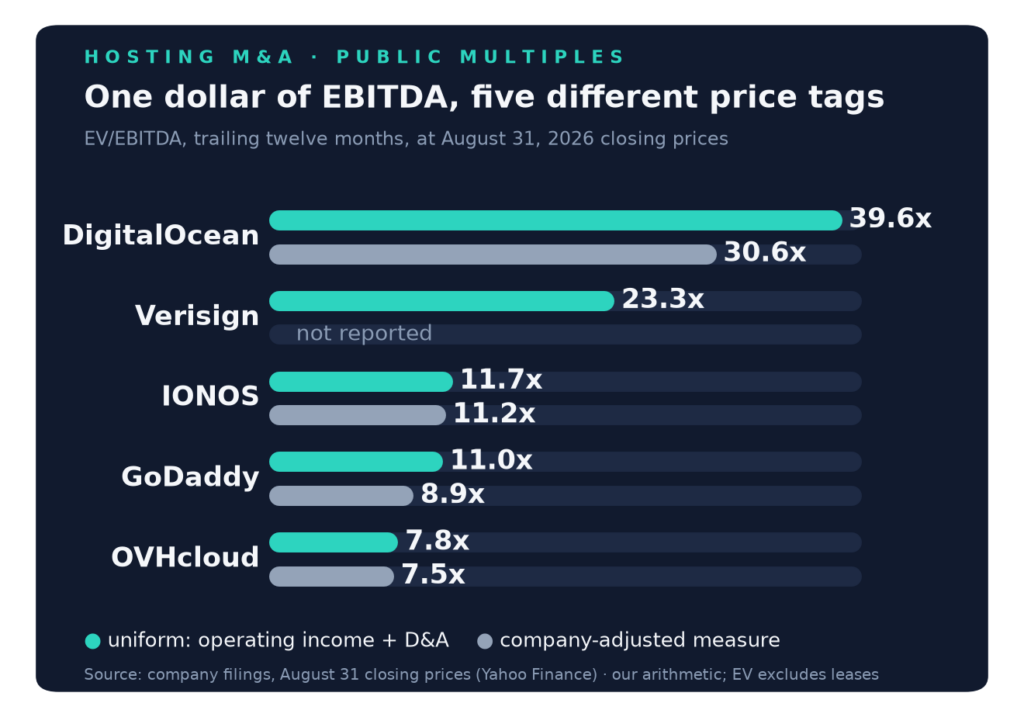
EV/EBITDA at August 31, 2026 closing prices, on a uniform measure and on each company’s own adjusted measure. Sources: company filings, our arithmetic.
Growth Explains the First Gap
The market’s clearest message sits in the gap between GoDaddy and DigitalOcean. GoDaddy books five times more revenue and threw off $914 million of operating cash flow in six months, yet its enterprise value, about $15.0 billion, buys each dollar of revenue for $2.94. DigitalOcean’s buys the same dollar for about $12.60. The growth line is the clearest contributor to the difference: 28.6 percent against 6.6. A buyer of GoDaddy’s stock pays for a mature, cash-generative business growing at a mid-single-digit rate; a buyer of DigitalOcean’s pays today for revenue the company has not booked yet. Nothing in that logic is exclusive to the stock market: in private hosting deals, demonstrated growth is one of the strongest arguments against being priced as a maintenance business.
Why the Fattest Hosting Margin Gets the Thinnest Multiple
OVHcloud is the table’s cautionary lesson. Its trailing EBITDA margin, 39.1 percent on the uniform measure, is the best of the four hosting and cloud names. On OVHcloud’s own adjusted measure it is 40.8 percent, close to the 40.9 percent half-year margin the company celebrated as a record since the IPO. The multiple is consistent with a market discount for capital intensity, debt and thin cash conversion: OVHcloud spent 42.9 percent of first-half revenue on capital expenditure, front-loading hardware purchases, and generated EUR 32.3 million of unlevered free cash flow from EUR 555 million of revenue. Add EUR 1.1 billion of net debt, 2.6 times its EBITDA by the company’s own measure, and 7.8x is what remains. EBITDA can flatter an infrastructure-heavy business; capex shows how much cash that infrastructure keeps absorbing. Any owner of an infrastructure-heavy host will meet the same arithmetic in a buyer’s model, usually on the first page.
The Discount That Is Not There, and the Ceiling That Is
A European discount is a frequent complaint of European sellers. This small sample cannot settle whether one exists across the board, but the two most comparable companies in the table do not show it: IONOS at 11.7x trades at a premium to GoDaddy’s 11.0x on the uniform measure, and the gap widens to 11.2x against 8.9x on the companies’ own adjusted figures, though those company-defined measures are less directly comparable. The growth rates are similar; the margin is better on a much smaller base. What IONOS does have is the profile buyers reward: 6.91 million customers, an adjusted EBITDA margin that improved four points between 2024 and 2025, and a portfolio built by acquisition, from STRATO to home.pl to Fasthosts, that the market now prices as one machine. It is also mid-divestment, with its domain marketplace Sedo held for sale to concentrate on web presence and cloud, and it has been buying back its own shares this year. Verisign, at 23x with a 69.4 percent margin, shows the ceiling of this logic: when revenue is highly recurring and the moat is written into the registry agreement, the multiple stops behaving like hosting and starts behaving like infrastructure royalty.
Reading the Ladder From a Seller’s Chair
For the owner of a private hosting company, this table is a reference point, not a price list. Public multiples reflect liquidity, scale and a level of audited disclosure that smaller private businesses rarely offer, and small-company deals generally price at a discount to all of it, and broker transaction data tracks how deep that discount runs. What transfers directly is the ladder’s logic. The questions behind each row, how fast the revenue grows, how much of EBITDA survives capex, how sticky the customer base is, are exactly the questions a buyer will put to a seller’s books. An owner who can demonstrate strong growth, real cash conversion and customer retention, even at a thousandth of the scale, makes a stronger case for the top half of the ladder.
Hosting M&A Consultation
Get one-on-one advice on maximizing your hosting company’s valuation and navigating the sale process.
About the Data
All financial figures are our calculations from primary filings: GoDaddy’s, DigitalOcean’s and Verisign’s 10-K and 10-Q reports via SEC EDGAR, IONOS Group’s 2025 results and half-year 2026 report, and OVHcloud’s FY2025 release and half-year FY2026 report, each read directly; share prices are August 31, 2026 closing prices as compiled by Yahoo Finance, a separate source from the filings. Trailing periods are summed from reported halves and quarters. Net debt excludes lease liabilities throughout, which is a real simplification in one case: DigitalOcean carried $577.7 million of finance-lease and equipment-financing obligations at June 30, covering servers and related equipment, outside our net debt figure. Share counts are the companies’ latest disclosed figures net of treasury shares. No cross-company average is drawn anywhere in this piece.

Sources
- GoDaddy Form 10-K 2025 - SEC EDGAR (official filing)
- GoDaddy Form 10-Q, Q2 2026 - SEC EDGAR (official filing)
- DigitalOcean Form 10-Q, Q2 2026 - SEC EDGAR (official filing)
- Verisign Form 10-Q, Q2 2026 - SEC EDGAR (official filing)
- IONOS Reports Successful 2025 Fiscal Year - IONOS Group (official)
- IONOS Group SE Half-Year Report 2026 - IONOS Group (official)
- OVHcloud FY2025 Results - OVHcloud (official)
- OVHcloud H1 FY2026 Results - OVHcloud (official)
- OVHcloud Q3 FY2026 Revenue - OVHcloud (official)
- Market data, September 1, 2026 - Yahoo Finance (market prices)