

Every platform sells speed. The word sits on every pricing page next to a rocket icon, and as marketed it cannot be checked, because no buyer benchmarks twenty providers before signing up. But the data to settle it is public, and it comes from the one source no vendor can spin: Google’s Chrome browser, measuring the real page loads of real visitors on millions of live customer sites. The Chrome UX Report feeds the HTTP Archive’s Core Web Vitals report, broken out by the platform behind each site. That field is deliberately mixed: traditional hosting providers, site builders and developer clouds alike, because the point is to compare across them. We pulled the full dataset for June 2026, the latest month available, and June 2024 for trend. The result is a league table, and the spread is wide. Among the mainstream brands the share of a platform’s customer sites that pass all three Core Web Vitals runs from 80.1 percent at Wix down to 38.7 percent at HostGator, more than a twofold gap. The smaller builders Duda and Jimdo score higher still. Speed is not a marketing constant. It is a measurable output that varies by vendor as much as price does.
Key facts (CrUX via HTTP Archive, June 2026, mobile, origin-level, recomputed from raw counts)
- The metric. The share of a platform’s measured sites whose real-user field data rates “good” on all three vitals at once: loading (LCP), responsiveness (INP) and visual stability (CLS). It measures an end result of the whole platform, its defaults and its customers’ own sites, not the underlying servers in isolation.
- The top is the builders, not the premium hosts. Wix 80.1 percent, Shopify 76.5, WordPress.com 73.1, Squarespace 70.1, with the smaller builders Duda (85.5) and Jimdo (94.3) higher still. Closed platforms beat nearly every traditional host.
- The bottom. HostGator 38.7 percent, Vercel 39.8, Netlify 41.2, Bluehost and Weebly 41.7, DreamHost 43.4.
- Sister brands diverge. WP Engine passes at 65.9 percent, its own stablemate Flywheel at 44.6, a 21-point gap inside one company. Kinsta 58.4, Cloudways 55.3, SiteGround 52.7.
- Scale and trend. GoDaddy is the most-measured host at 603,894 mobile origins, passing 57.0 percent. Every tracked platform improved over 24 months except Weebly (down 7.6 points); HostGator gained the most, 18.3 points, from a very low base.
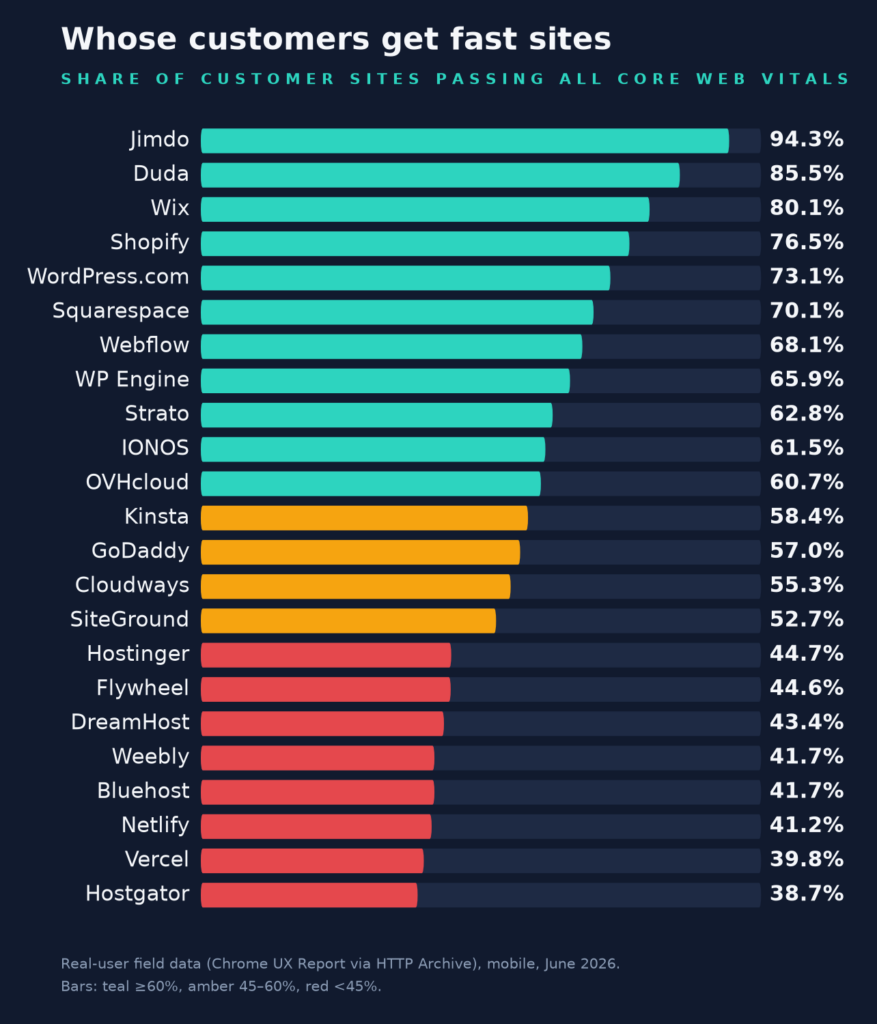
Share of customer sites passing all three Core Web Vitals, mobile real-user data, June 2026. Source: HTTP Archive Core Web Vitals report.
What the Table Actually Measures
Three properties make this dataset hard to game. It is field data, not a lab test: it records what real Chrome users experienced. So it captures the platform’s stack under real load, including the overloaded shared servers and unoptimized customer sites a vendor’s own benchmark never shows. It is origin-level, meaning every measured site counts once, so the number describes the typical customer’s outcome, not the traffic of a few flagships. And the attribution is mechanical, by technical fingerprint, not by asking anyone’s marketing team. The pass mark is Google’s own: a site passes if its 75th-percentile experience is good on loading under 2.5 seconds, responsiveness under 200 milliseconds, and visual stability. These are the same signals that feed search ranking. So a hosting executive should read the table as the share of their measured sites that Google would count as fast, and for the bottom third the honest answer is a minority.
One caution belongs up here, not in a footnote at the end: this ranks an end result, not raw infrastructure. The number is shaped by the platform’s defaults and by its customers’ own themes, plugins, ads and marketing scripts, so a low score flags a slow outcome, not a proven cause. Everything below reads against that limit.
Control Beats Hardware
The clearest pattern is that the top of the table is not the expensive hosts but the closed platforms. Wix, Shopify, WordPress.com, Squarespace, and the smaller Duda and Jimdo all outperform nearly every traditional host, including the premium managed-WordPress tier that sits mid-table. The mechanism is not mysterious. A builder that owns the theme, the media pipeline, the JavaScript budget and the CDN can engineer vitals centrally, and Wix moving up nearly 23 points in two years shows what a platform-wide program does. Open hosting inherits its customers’ plugin habits instead.
That explanation only stretches so far, because the spread within like-for-like categories is just as telling. WP Engine and Flywheel sell managed WordPress from the same parent, and there is a 21-point gap between them. Among the European volume hosts, Strato (62.8), IONOS (61.5) and OVHcloud (60.7) sit a clear 15 to 25 points above the US budget brands. And the Newfold pair anchors the low end, though the picture has shifted. HostGator, at 38.7 percent, is the floor of the mainstream table, while Bluehost has climbed to 41.7, up more than 15 points in two years off a very low base. A pass rate this low is not proof of a thin stack, but it is consistent with the underinvestment we have tracked through Newfold’s debt. The field data alone cannot establish the cause, since customer mix and site choices move these numbers too; it raises the question rather than settling it.
The Developer Clouds Fail on Responsiveness
The other surprise is the developer clouds. Vercel (39.8) and Netlify (41.2) rank alongside the cheapest shared hosting, despite selling performance to the most performance-literate audience in the market. The breakdown says why. Their responsiveness is the worst in the field: Vercel passes INP on just 61.7 percent of sites and Netlify on 69.4, against 86 to 92 percent at the builders and the big shared hosts. That is the signature of heavy client-side JavaScript, exactly what gets shipped to those platforms. Their loading is weak too, so this is not a single-metric stumble. The lesson for product teams is precise: the framework era moved the bottleneck from the server to the customer’s bundle, and infrastructure brands are now graded on their customers’ architectural choices. The builders solved that by owning the architecture. Open hosting has not, which is why the frontier is default-on optimization, the platform-level caching, image pipelines and script management that lift a customer’s vitals without the customer lifting a finger.
Your Rivals Can Already Quote Your Number
First, know that number yourself, because a rival can. Everything here came from a public API, so any competitor’s sales team can quote a rival’s pass rate to its prospects. For a brand in the bottom third, the gap to the 58 percent median is an engineering program with a measurable target, and the two-year deltas prove such programs work. Hostinger moved 12 points and HostGator 18 from low bases. Second, it is a sales asset the leaders barely use. “Our customers pass Core Web Vitals at a higher rate than X, on Google’s own field data” is a claim with a citation, and almost nobody in the top half makes it. Third, the number is a screening signal for portfolio and acquisition work: a low pass rate is a flag worth a data-room follow-up, not a standalone verdict on the stack. We plan to re-run the table on the same method so the movements stay on the record.
About the Data
Figures come from the HTTP Archive Core Web Vitals report’s public API, pulled August 12, 2026 for the June 2026 dataset, the latest available, with June 2024 for trend. The metric is the share of a platform’s origins rated “good” at the 75th percentile on all three vitals, mobile, all geographies. We recomputed every percentage from the raw good and tested counts rather than trust dashboard rounding. Attribution is by technical fingerprint, so platforms detectable only by subtle signals are undercounted, and Pressable and Cloudflare Pages are absent. Nexcess and Pagely were too small to rank. The two-year lift partly reflects Chrome engine changes, so relative position matters more than absolute gains.
