
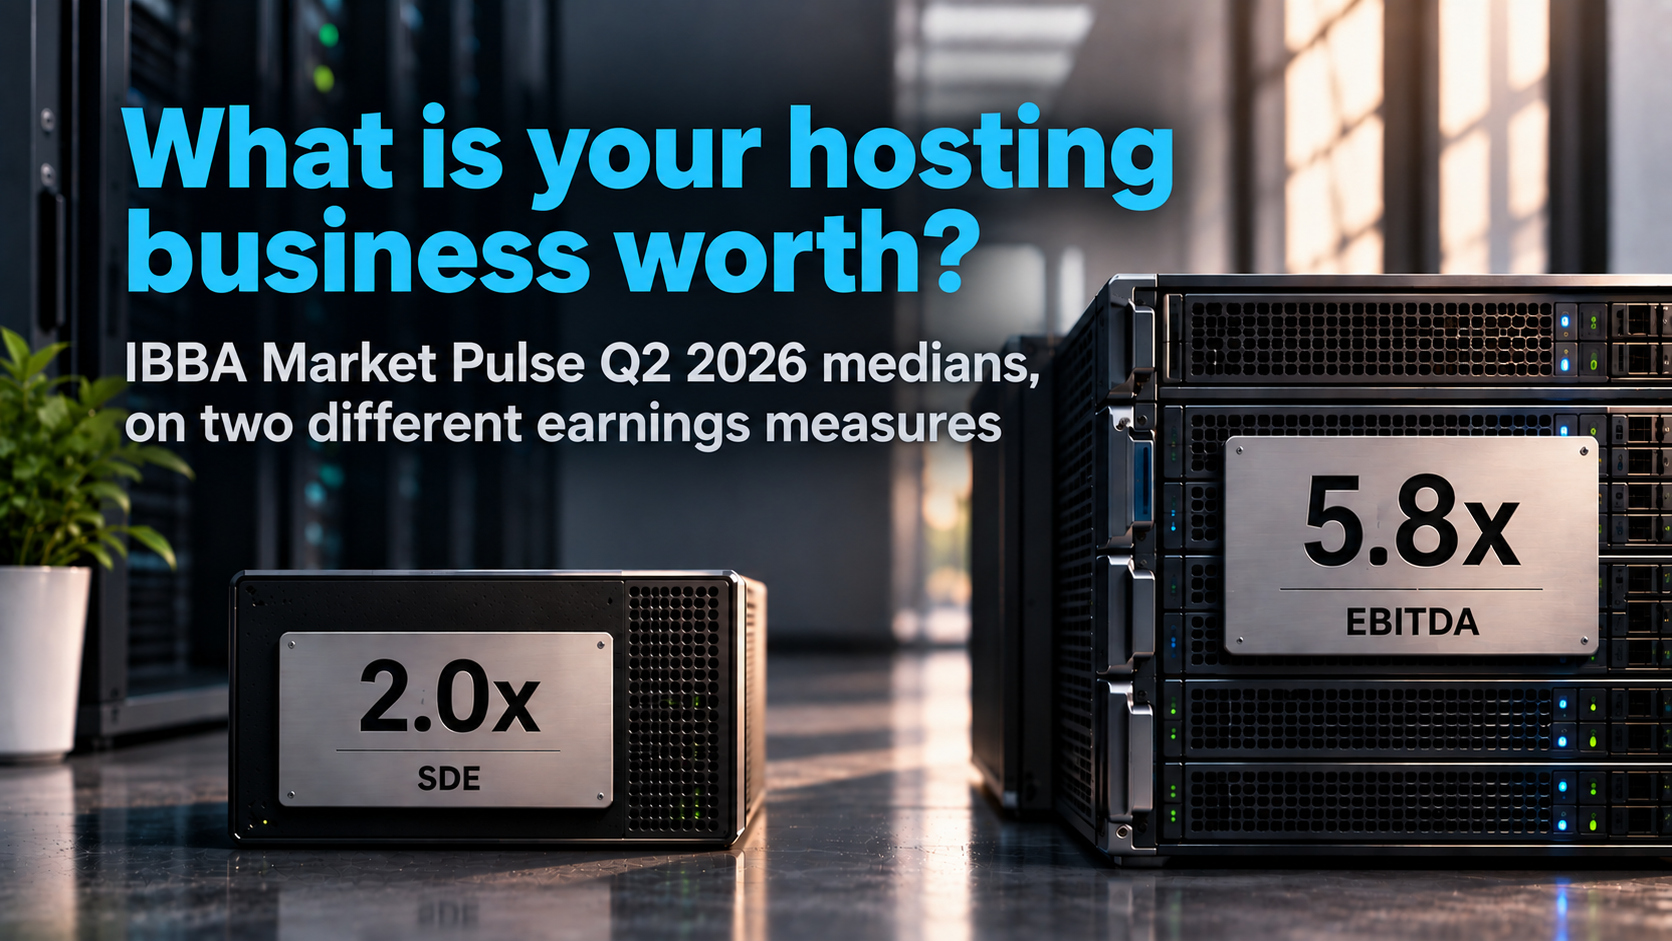
A hosting owner working out what the business is worth will find the private-market data easy to misread. In the most recent quarter, the reported multiples run from a median of 2.0 times earnings at the bottom of the market to 5.8 at the top, but those two numbers are based on different earnings measures. The quarterly Market Pulse survey, which tracks completed sales of private businesses up to $50 million, reports its smaller segments as multiples of the owner’s total benefit and its larger ones as multiples of EBITDA. The bottom of that range is also exactly where it stood in 2023.
Key facts
- The ladder: five price bands running from a median of 2.0 at the bottom to 5.8 at the top, the lower three quoted on the owner’s total benefit and the upper two on EBITDA.
- The divergence: the top band has climbed from 4.8 in 2023 to 5.8, its highest since the first quarter of 2022. The smallest band was 2.0 in 2023 and is 2.0 now.
- Tone by size: 76 percent of advisors called the $5 million to $50 million segment a seller’s market, against 22 percent for deals below $500,000.
- Where interest is moving: asked where they see buyer interest heading, advisors placed technology, SaaS and IT services near zero, while manufacturing, distribution and business services sat far above it.
One Ladder, Two Measures
Those medians come from a survey fielded in the first half of July 2026 and completed by 255 brokers and advisors reporting 181 closed transactions, each figure the median multiple reported for transactions in that price band.
| Sale price | Q2 2023 | Q2 2024 | Q2 2025 | Q2 2026 | Measured on |
|---|---|---|---|---|---|
| Below $500,000 | 2.0 | 2.0 | 2.3 | 2.0 | SDE |
| $500,000 to $1 million | 2.8 | 2.8 | 2.8 | 2.8 | SDE |
| $1 million to $2 million | 3.0 | 2.8 | 3.0 | 3.1 | SDE |
| $2 million to $5 million | 4.5 | 3.5 | 3.9 | 4.0 | EBITDA |
| $5 million to $50 million | 4.8 | 5.3 | 5.5 | 5.8 | EBITDA |
Read as a single ladder, that looks like a smooth progression in which size is rewarded. It is not one ladder. The first three rungs and the last two are quoted on different earnings figures, which means the step between 3.1 and 4.0 is not the same kind of step as the one between 2.8 and 3.1.
Two Earnings Numbers, and Where the Survey Draws the Line
Market Pulse states that split in a footnote, and it is worth reading as what it is: how this survey classifies its own segments. It reflects a real shift in how larger businesses are underwritten, but it is a reporting convention rather than a universal rule. In an individual deal the measure used follows from the business, its size and its likely buyers rather than from a hard threshold.
The two measures treat the owner differently, and that is the key distinction here. Seller’s discretionary earnings describes the economic benefit available to one working owner: it adds back that owner’s compensation and benefits, alongside accepted personal, non-recurring and non-operating adjustments. In larger private deals, buyers will typically normalize EBITDA as part of their underwriting. Instead of fully adding the owner’s compensation back, adjusted EBITDA replaces it with the market cost of employing someone to perform the work that has to continue after the sale.
For a founder who answers tickets, tunes servers and signs invoices, the practical gap between the two figures is close to the cost of replacing that founder’s own work. For a working-owner business adjusted EBITDA will generally be the smaller of the two figures, so a multiple applied to it would have to be larger to reach the same price. Taking a number from the upper rungs and applying it to discretionary earnings is not optimism. It is a category error, and it inflates on both sides at once.
The Two Ends Are Moving Apart
Read across the rows, the pattern is a market pulling apart. The top band has risen in every reading since 2023, reaching 5.8, its highest since the first quarter of 2022. The band below $500,000 advanced once, to 2.3, and gave it back. The middle barely moved at all, and the $2 million to $5 million band is still below where it stood in 2023.
Sentiment splits the same way. Asked whether their segment favored sellers, 76 percent of advisors said yes for the $5 million to $50 million band and 22 percent said yes for deals below $500,000. The survey’s chairman, James Parker, put the same division in words. “The market is not moving in one direction,” he said alongside the results. “Above $2 million, strong businesses are still drawing meaningful competition. At the smallest end of the market, however, buyers have more leverage and are more sensitive to financing, margins, and operating risk.”
The largest deals are being repriced. The smallest are not, and the band between $2 million and $5 million is still below where it stood in 2023. For a small hosting owner the broader-market signal is narrow but clear: the smallest segment has seen no sustained multiple expansion since 2023.
What Buyers Are Drawn To, and What They Are Not
The second-quarter survey also asked advisors where they see buyer interest moving, scored by sector. It measures sentiment rather than completed transactions. Manufacturing, distribution, business services, infrastructure, healthcare and construction all scored strongly positive, while technology, SaaS and IT services sat near zero, marginally on the negative side, in both size segments. The survey does not isolate hosting, but in the sentiment of the advisors who broker these deals, technology is not among the sectors attracting increasing buyer interest.
A separate finding from the first quarter adds context. Asked how AI adoption had affected the valuations they were seeing, 67 percent of advisors reported no material impact, against 12 percent seeing a slight increase, 3 percent a slight decrease and 15 percent saying it was too early to tell. On this evidence, AI adoption has not yet produced a broad or consistent valuation premium.
Hosting M&A Consultation
Get one-on-one advice on maximizing your hosting company’s valuation and navigating the sale process.
Public Multiples Are Context, Not a Comparable
By our own measurement of five listed hosting, cloud and domain companies at the start of September, enterprise value to trailing EBITDA ran from 7.8 times at the low end to 39.6 times at the high end. Those figures are sector context, not a valuation benchmark for a private hosting business. Listed companies bring scale, liquidity, audited reporting, management depth and diversification that a small private host generally does not, and the comparison fails in both directions: a strategic buyer with a reason to own a particular book can pay well above what any public screen would suggest.
What a Buyer Opens First in a Hosting Business
Within a band, the difference between a median multiple and a good one is what due diligence finds. In hosting, a handful of items do most of the work.
- The shape of the recurring revenue. Billing cadence and renewal behavior are not interchangeable. Neither is revenue that depends on a steep renewal step. Our own index of renewal pricing this year found renewal-to-intro multipliers running as high as 5.3 times, and a book approaching that kind of step raises a retention question a buyer will model. If the historical cohorts show elevated churn at renewal, it feeds straight into the underwriting.
- Cost dependencies the buyer inherits. Control panel licensing is the clearest example. cPanel moved in 2019 from a flat per-server license to pricing by account count, with charges for each account above one hundred, so the software cost of a growing shared-hosting estate can rise with its cPanel account count rather than with its customer count. Plesk and SolusVM sit under the same owner, WebPros, though their licensing works differently.
- Concentration. A reseller channel where three partners carry most of the accounts, or a customer base weighted to one agency, is a different asset from the same revenue spread across thousands of unrelated cards.
- Owner dependence. The more of the business that lives in the founder’s head and inbox, the larger the market-rate salary a buyer has to normalize into adjusted EBITDA, and the further discretionary earnings sit above the figure a buyer will actually underwrite.
Time Is Part of the Price
Timing matters as much as the figures. Main street businesses took six to ten months to close in the second quarter of 2026, and lower middle market deals eleven to twelve. The $2 million to $5 million band lengthened from nine months to eleven and a half in a single quarter.
The changes that move a valuation most convincingly are the ones already visible when the process starts. A buyer can credit improvements made along the way, but a full year of clean trailing results is stronger evidence.
The Order of Operations
The sequence matters more than the arithmetic, and it does not begin by choosing a measure.
- Calculate both figures separately: a defensible seller’s discretionary earnings and a defensible adjusted EBITDA, with the add-backs a buyer will accept rather than the ones that feel fair.
- Work out the likely buyer universe and the enterprise value range that follows from it.
- Apply the earnings measure and the market reference that suit that range, then check that the valuation it implies actually lands inside the band the multiple came from.
- Only then adjust the multiple for growth, retention, concentration, margin and owner dependence.
Most of what an owner can still influence sits in the quality of those earnings and in the four diligence items above. Those usually take longer to improve than a sale process lasts. The multiple is the last number in the sequence and the one an owner controls least.
For an owner weighing a sale, this is also where an outside view can be useful: understanding how a buyer is likely to read the business while there is still time to address what they will find. A one-on-one M&A consultation can provide that perspective before the process starts.
About the Data
The private-market figures come from the Market Pulse survey by the International Business Brokers Association and M&A Source: the second-quarter 2026 edition, fielded July 1 to 15 with 255 advisors reporting 181 closed transactions, and the first-quarter edition, fielded April 1 to 16 with 300 advisors reporting 203 transactions. Only the quarterly highlights are public; the full results go to participants. The survey covers United States transactions across all industries and does not break out hosting, so its structure offers context while its medians describe a broader market. The highlights do not explain how the buyer-interest score is calculated, so those are given in relative terms only. The listed-company multiples and the renewal index are our own; the control panel licensing details come from vendor documentation.

Sources
- Market Pulse Q2 2026 Highlights - International Business Brokers Association and M&A Source
- The Market Pulse Survey Q2 2026 Reports the Latest Trends in Business Sales up to $50M - PR Newswire
- Market Pulse Q1 2026 Highlights - International Business Brokers Association and M&A Source
- The Market Pulse Survey Q1 2026 Reports the Latest Trends in Business Sales up to $50M - PR Newswire
- Business Broker Industry Research - International Business Brokers Association (report index)